
In today’s diagnostics, speed, accuracy, and quantification are non-negotiable. This is why Quantitative Polymerase Chain Reaction (qPCR) is the gold standard, offering a highly sensitive method for identifying and quantifying specific genetic material.
Why Use qPCR? The Key Advantages
While qPCR relies on the same core principle of DNA amplification as traditional PCR, PCR followed by gel electrophoresis typically provides only a “yes/no” answer and is generally less sensitive. Scientists and diagnosticians rely on qPCR because it provides three major benefits:
- Sensitivity and Accuracy: It can detect and amplify even minute traces of genetic material with high accuracy.
- Built-in Quality Check: It allows for multiplexing, meaning you can detect your target of interest AND an “internal control” (a known genetic marker) in the same reaction. This confirms the test itself worked correctly, ensuring confidence in your results.
- Quantification: It doesn’t just tell you if a target sequence is present; it tells you how much is there.
The Principle: Amplification and Real-Time Measurement
qPCR measures DNA amplification in real-time. One way to achieve this is to use fluorescent probes alongside primers. As the target DNA, demarcated by the primer target sequences, is copied and amplified, the fluorescent signal emitted increases and is detected by the qPCR machine. Significantly, the fluorescence signal scales linearly with the amount of DNA being amplified, enabling precise quantification of the target sequence.
Furthermore, by using probes labeled with different fluorophores, it is possible to simultaneously follow the amplification of multiple targets in the same reaction tube. This enables diagnostics by amplifying a target sequence alongside an internal control gene, which ensures the genetic material was extracted correctly.
Analyzing RNA Targets (RT-qPCR)
While qPCR amplifies DNA, what if your target is an RNA molecule (like those from viroids and many viruses)? This is where Reverse Transcription Quantitative Polymerase Chain Reaction (RT-qPCR) comes in.
RT-qPCR is a two-step process for RNA detection:
- Reverse Transcription (RT): An enzyme called reverse transcriptase first converts the target RNA molecules into stable complementary DNA (cDNA).
- qPCR: This cDNA is then amplified and quantified using the standard real-time fluorescent process described above.
Importantly, the RT and the qPCR steps can be combined in the same reaction tubes by using optimized enzyme mixes, such as the one used in our HLVd RT-qPCR Detection Test.
Reading the Data: The Sigmoid Curve and the Cq Value
Data interpretation requires manually checking two things: the shape of the amplification curve and the Cq value. Let’s break down these two concepts.

This schematic illustrates typical qPCR results. The graph displays the characteristic “S-shaped curves,” which signify successful amplification, and defines the Cycle threshold (Cq) value. The Cq is the specific cycle number at which the fluorescent signal crosses a predetermined threshold (indicated by the dotted line), marking detectable target amplification.
Successful qPCR data is visualized by a clear, characteristic S-shaped (sigmoid) curve, where you can identify two phases:
- Exponential Phase: representing the phase during which the DNA product doubles each cycle.
- Plateau: Representing the end of the reaction.
The other critical measurement is the Cycle Threshold (Cq) value. The Cq value is the cycle number at which the fluorescence signal crosses a defined threshold. Cq is inversely proportional to the amount of target you started with. In other words, a lower Cq indicates a higher initial amount of the target in the collected sample.
For reliable results, Cq values typically need to be below 36. Values above this are less reliable because the signal becomes too close to background noise, reducing confidence in the final quantification.
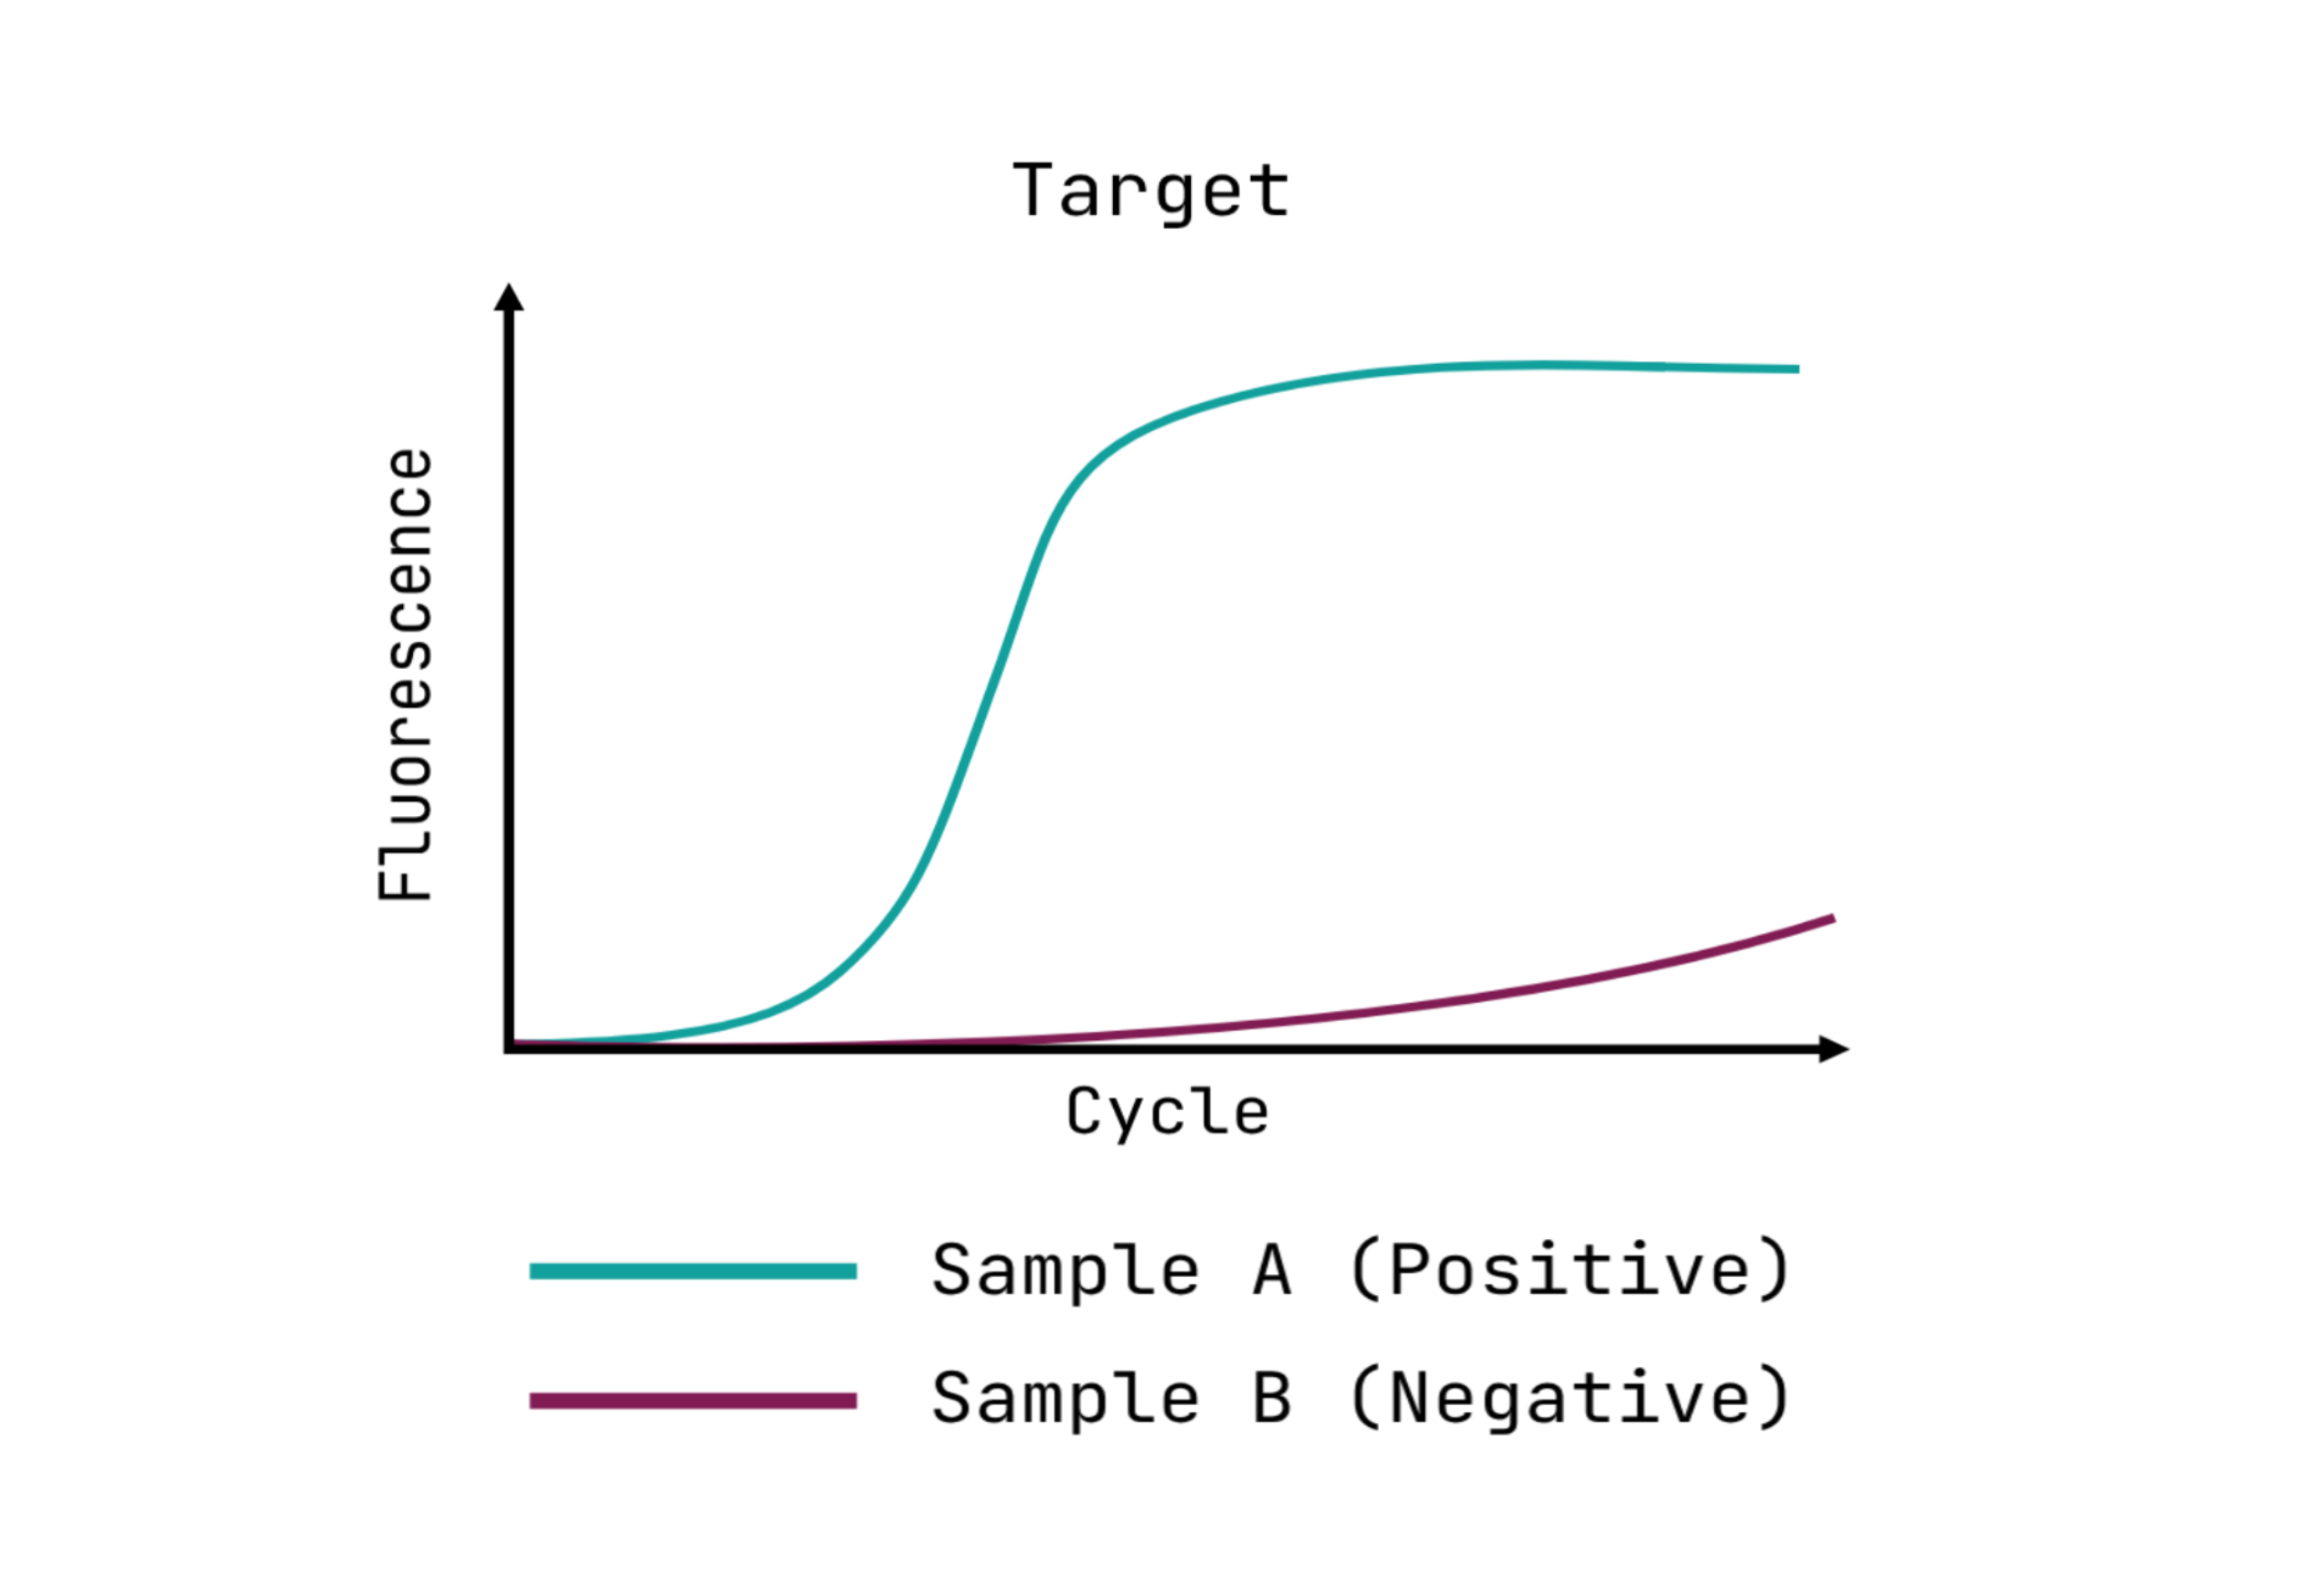
For a valid test, you will also need to make sure that there is no amplification in your negative control (no template control), and that there is successful amplification in your positive control.

This schematic illustrates the amplification curves for two test samples. Successful genetic material extraction is confirmed by the visible amplification curves in the internal control channel for both samples. However, the results show that only one sample (Sample A, tile color) is positive for the target sequence.
What You Need for qPCR
Traditionally, running qPCR required bulky, complex, and expensive laboratory instruments. However, at miniPCR Dx, we offer a portable, user-friendly solution: a compact thermal cycler that weighs only 4.5 lbs, enabling simultaneous runs of 14 samples plus 2 controls.
Ready to get started? Discover our convenient Cannabis qPCR Workstation which contains the qPCR machine, essential lab equipment, a validation test to familiarize yourself with qPCR, and a test kit of your choice!